May 15, 2016
Mish's Daily
By Mish Schneider
This week is likely to be a tipping point for the market.
Today's commentary was written by Geoff Bysshe, co-founder of MarketGauge.
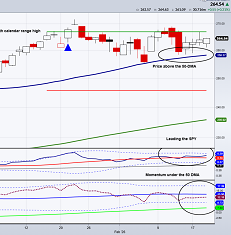
Over the last two weeks I’ve focused this commentary on the likelihood of the SPY, IWM and DIA holding their 50 DMA as support while the QQQ had already pierced its respective level.
A break of this level could lead to a significant drop and an ugly defeat of the Bulls.
On the other hand, this is the first retracement to the 50 DMA and the more oversold the market gets before a successful bounce off of this level, the bigger the resulting up move can be.
A big move higher from here will be a painful missed opportunity (or worse) for anyone who is bearish going into it.
Which way to play this market is a hot potato you don’t want to be holding when the market picks it’s final direction, and it’s about to get hotter.
After the SPY’s initial bounce off of this extremely important support level (50 DMA) early last week, disappointing earnings reports from retailers like Macy’s (M), Kohl’s (KSS), and J.C. Penney (JCP), sent the market steadily lower.
Now for the second Friday in a row the markets sit on the 50 DMA and traders will have the weekend to try to determine if Monday will be the day that defines a significant low or the beginning of a potentially big drop.
Last Friday I was a little more optimistic about the markets’ strength and the Bulls’ resolve than I am this weekend. As you’ll read in the ETF details below, since last week the Economic Modern Family has gotten weaker.
In addition, some of the anecdotal measures of the market’s health that I’ve discussed recently have also become more bearish.
And this week the pressure on both bulls and bears will increase.
Last week, bad earnings reports from the big box retailers weighed on the markets. Surprisingly, on Friday the government retail sales data posted a much higher than expected value, 1.3% vs. expectations of .8%.
While this may seem contradictory, the high profile negative earnings reports came from departments store retailers, while the government data includes a broader measure of consumer spending (including ‘non store retailers’, a.k.a. internet sales)
This contradiction between earnings and retail sales figures should see more clarity this coming week as there are several more retailers announcing earnings including COST, HD, and TGT and more. If earnings reports continue to disappoint, the optimistic retail sales data will be dismissed and stocks will be under pressure.
The best way to figure this out is to watch our Economic Modern Family member, XRT, the Retail ETF to see how the market is feeling about the consumer’s propensity to spend. If the market is going to move higher, XRT is going to have at least stabilize.
Additionally, as I mentioned several days ago, the Consumer Staples ETF, XLP is another indicator to watch for the strength of consumer driven stocks. It hit a new 52 week high this week, but in Friday’s weakness it was much weaker than the market. If the market breaks down with this moving strongly to the downside, this is not a good sign for the bulls.
Finally, I haven’t seen much media attention given to what I consider to be the most bearish indicator for stocks going into next week. This is the fact that the “flight to safety” ETF, TLT, rallied sharply on Friday clearing significant levels of resistance.
In the wake of positive economic data in retail sales TLT’s rally is contradictory to what traders would expect, unless of course, the more pressing issue on traders’ minds is to hide from stocks until the game of hot potato cools off.
In defense of the Bulls, the 50 DMA and the May 6th lows have held their ground despite a lot of pressure from the Bears. If the market can reverse last week’s slide by closing over Friday’s high, the momentum could quickly turn in the bulls favor.
Mish will be back Monday, so in our own game of passing the potato here at MarketGauge, I’m happy to have her back to help you figure out next week’s markets!
S&P 500 (SPY) No bounce today. Closed under the 50 DMA for the first time since February which puts it in an unconfirmed Warning Phase. Swing low support is 203.88. Minor support at 203, then the 200 DMA at 201.30. Resistance at 205.37, then Friday’s high.
Russell 2000 (IWM) Tested the May 6th swing low by taking it out by a few cents again and closed a few cents over it. Needs to hold Friday’s low. Next big level of support is 108.50. Needs to clear 111.15 to move higher.
Dow (DIA) Unconfirmed Warning Phase and closed under the May 6th low. Minor support at 174.70, then 173.70. Look for resistance at 176.40 and the Friday’s high.
Nasdaq (QQQ) Inside day. 105 should be support, but big picture is that the range to focus on is 108 to 104. It closed near the middle at 105.50
XLF (Financials) Closed pennies above the May 6th low and the 50 DMA is 11 cents lower at 22.77. 22.62 and 22.40 should be more support. 23 is big resistance.
KRE (Regional Banks) Closed on May 6th low and under 50 DMA. Unconfirmed warning phase. Big support it 37. 38.70 is resistance.
SMH (Semiconductors) After a very weak Thursday on huge volume, Friday was an up inside day that has its low higher than the May 6th low. 51.30 is the key level to hold. Thursday’s low is 50.88. Needs to clear 52.70 – 53.00 move higher.
IYT (Transportation) Continued to slide on big volume. Held expected support at 134. May be some support at 132.50 area. Expect resistance at 136.50.
XRT (Retail) Big rally from 41 to 42 on big volume was squashed by selling during the rest of the day. Closed lower and on the low of the day at 41 which is the top of the expected 41 to 40 area of support from prior swing lows, and the 200-week moving average. Warning: Next week is another week of a lot of retailer earnings reports.
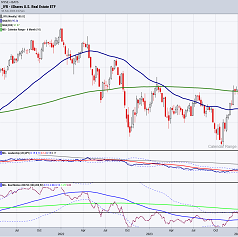
IYR (Real Estate) Sitting on support at 78.30 and the 10 DMA. Looks good if it clears 79.05.
GLD (Gold Trust) Consolidation day on top of support area,120.50 to 120.
SLV (Silver) Consolidation day. Needs to hold 16.
GDX (Gold Miners) Inside day sitting on the 10 DMA.
USO (US Oil Fund) Very tight range inside day. 11.50 is the high to break then the 200 DMA is at 12. For support the big level is 11.
XOP (Oil and Gas Exploration) In a support area with bigger support at 32.70, but it really needs to clear 34.60 to consider a move higher.
TAN (Guggenheim Solar Energy) Tight consolidation day at 21 level of support, but it needs to clear 22 to consider a move higher.
TLT (iShares 20+ Year Treasuries) Completely the opposite of yesterday and exactly as I would have expected market’s to act. TLT’s gapped higher and moved steadily higher as stocks did the opposite. Closed over a major trend line from the February highs and over the key 132 resistance. Key resistance levels are 132.40,133, 133.40 and 135.25. Support is around 132 and 131.
UUP (Dollar Bull) Higher again. Stopped at key resistance and 50 DMA near 24.60. Support is now 24.40. Next big level to clear on the upside is 24.67.

Every day you'll be prepared to trade with: