April 3, 2016
Mish's Daily
By Mish Schneider
When To Buy A Lower Open
Today's commentary was written by Geoff Bysshe, co-founder of MarketGauge.
Friday provided 2 very good examples of how to trade this market from the long side.
Before U.S. stocks opened on Friday they were lower. When the jobs data was released at 8:30 a.m. it did not contain any big surprises that would have justified a big move in the markets in either direction. Regardless, stocks edged further down after the news. This suggested that the report would not provide traders with an easy reason to buy the open.
However, the lower open combined with the much anticipated (but uneventful) economic report would provide traders with the opportunity to test the resolve of the bulls, because...
By the time the regular session opened at 9:30 the SPY was sitting at its lows of the overnight trading session, and below the lows of the prior two days.
This lower open provided the first of Friday’s 2 very good examples of how to trade this market from the long side.
When the stocks opened the major index ETFs (SPY, DIA, QQQ, IWM) all made new daily lows in the first 15 minutes relative to their first 5 minutes of trading (Opening Range, “O.R.”). However, they all refused to continue lower.
This failure to move lower after several attempts, was followed by the opposite result when they all moved up and over their initial 5-minute O.R. On a 5-minute basis all 4 closed over their 5-minute O.R. and consolidated at the higher level.
For most traders and active investors trading based on the first 5-minutes of the day can be tricky, so unless you’ve been trained or have a lot of experience you’re better off focusing on how the first 30 minutes of the day shakes out. However, when you see this pattern of the market failing to go down then consolidating near the highs of what soon becomes the 30-minute opening range. You should take note.
This pattern is a particularly powerful when you have certain daily patterns, and we had one leading up to Friday…
Since the February lows, the markets have not had more than a few days at a time in which they’ve moved lower, and traded below multi-day lows. In this type of an environment of rallies that routinely follow a 2 to 3 day rest, buying a lower open using the 30-minute O.R. as your guide can provide predictable, low risk, and quickly profitable day trades and swing trades.
For example, on Friday the first 30-minutes demonstrated an attempt by the markets to move lower which proved to be weak. This was then followed by a strong breakout over the 30-minute O.R. high which provided traders with an entry point for trades against the low of the day.
This pattern in the overall market does not mean you must buy the SPY, QQQ, IWM, or DIA. It can also be used as an indicator that it is the right day to buy individual stocks or ETFs that may be in a more advantageous pattern than the general market.
Friday’s second example of how to trade this market demonstrates this concept perfectly!
The market is clearly in an uptrend, but it’s also clear that there is a lot of resistance right above the current price levels. This resistance suggests there could be turbulence ahead.
A savvy approach to swing trading and day trading regardless of whether the market is trending nicely or in a condition with a lot of resistance (like now) is to focus on the ETFs of leading industry groups, AND ETFs of industries that are changing their phases!
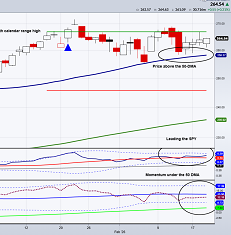
If you’ve been following Mish’s Economic Modern Family, and you identified Friday’s 30-minute O.R. breakout as a bullish indicator, then you may have been fortunate to have caught IBB as it broke out over its O.R. and over its 50-day moving average creating the first step to phase change!
IBB was not only breaking out over its 30-minute O.R. with the market on Friday, it was also a leader on the day. It was one of the few areas of the market that was up on the day as the markets broke above their 30 minute O.R.
This is the first time this year that IBB has closed over its 50 DMA. Plus, it experienced the most volume it’s had since prior to its February lows.
Furthermore, it has a well formed two month base that has its high only a few dollars away at 272. A break above that level would mark a good confirmation that this phase change is one that could be very significant even if the general market’s uptrend stalls.
It is likely that there will be several opportunities to take advantage of any up trend that develops in IBB so you have not “missed it”. And you can be sure Mish’s Daily will continue to keep you on top of it.
After all, IBB is a member of the Economic Modern Family!
S&P 500 (SPY) Key levels to watch for resistance are 207.80 and 208.50. Support should show up at 206.40 and 205 and Friday’s low around 204.
Russell 2000 (IWM) Use Friday’s range 109.48 – 111.22 as your barometer of this market’s direction for the week. There should also be support at the 110 area.
Dow (DIA) Use Friday’s range 175.41 – 177.85 as your barometer of this market’s direction for the week. There should also be support at the 176.50 area.
NASDAQ 100 (QQQ) Use Friday’s range 108.39 – 110.40 as your barometer of this market’s direction for the week. There should also be support at 109.70 and 109.
XLF (Financials) Important support is 22.10, and needs to clear 22.80 to breakout of its range.
KRE (Regional Banks) 50 DMA is finally turning up and sits at 36.42. Between that level and 33.83 it’s stuck in a range.
SMH (Semiconductors) Rallied with the market on Friday, but did not get near last week’s high. 55 is a pivotal support level to hold.
IYT (Transportation) Didn’t keep up with the market on Friday or for the week. It seems a bit tired now - under 140.50 should see selling.
IBB (Biotechnology) Finally broke the 50 DMA, and did so with big volume. REGN was the primary source of strength but 9 of the top 10 holdings in the ETF posted solid gains and several look poised to move higher. A second close over the DMA would confirm a bullish phase change to an Accumulation Phase. For nimble traders an O.R. reversal between 264 and 264.70 could be a nice opportunity for a low risk entry. A break above the two month base high of 272 is the next step for the bulls.
XRT (Retail) Friday’s low, 45.64, should be good support, but I’d be cautious under 46.
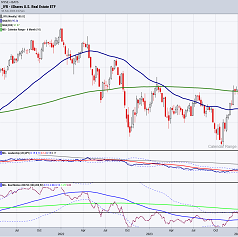
IYR (Real Estate) Had good volume on Friday and looks poised to run if it can break 78. The key support level to hold is 77.25.
ITB (US Home Construction) Good consolidation just over the 200 DMA, and an impressive inside day on Friday considering the market’s lower open.
GLD (Gold Trust) Friday’s low touched the 50 DMA for the first time since January. 115-122 is the range to break one way or another. 119 is a significant resistance level.
SLV (Silver) Closed under 50 DMA for the first time since January lows. It needs to get back over 14.50 for me to be bullish again, but the 14 area may be good support and is the area of the 100 DMA.
GDX (Gold Miners) Range bound at 18.50-21.00, and March led to a well-defined wedge suggesting the next move may come soon. Relative to its 50 DMA it has held up better than GLD.
USO (US Oil Fund) Broke the key low of its range of 9.59 to 10.80, and now sits on its 50 DMA at 9.30. Key levels to watch now are 9.60 to break higher and 9.00 as support below its current level.
TAN (Guggenheim Solar Energy) Since January every multi-week turning point and move has been very correlated with USO. Both now sit at good levels to form a swing low. 21.50 in TAN is the key level for it to hold.
UUP (Dollar Bull) 24.40 has been a big support level since May of 2015. A break below it would be a major breakdown.

Every day you'll be prepared to trade with: