May 4, 2016
Mish's Daily
By Mish Schneider
On really bad days, everything falls.
Today's commentary was written by Geoff Bysshe, co-founder of MarketGauge.
Yesterday’s comments looked at how TLT’s relationship with SPY can give you insight into the health of the market’s trend. In short, real bearish days will see big moves up in TLT’s when stocks are dropping.
Today’s action was unhealthy by that definition, but there is more to today’s story.
Yes, the Economic Modern Family is falling apart, albeit slowly. In fact, the last holdouts, SMH and IYT closed under their 200 DMA today to join the rest in that unhappy club.
But the market didn’t collapse. Why not? Maybe the market is hoping the jobs report on Friday will inspire the bulls?
As I said yesterday… We don’t need to figure it out. The market was not all down today, and that was the key.
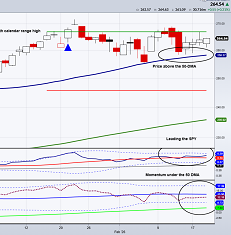
When the market goes into a serious down trend everything gets hit. Today that was not the case. Below is a chart of the Consumer Staples ETF (XLP).
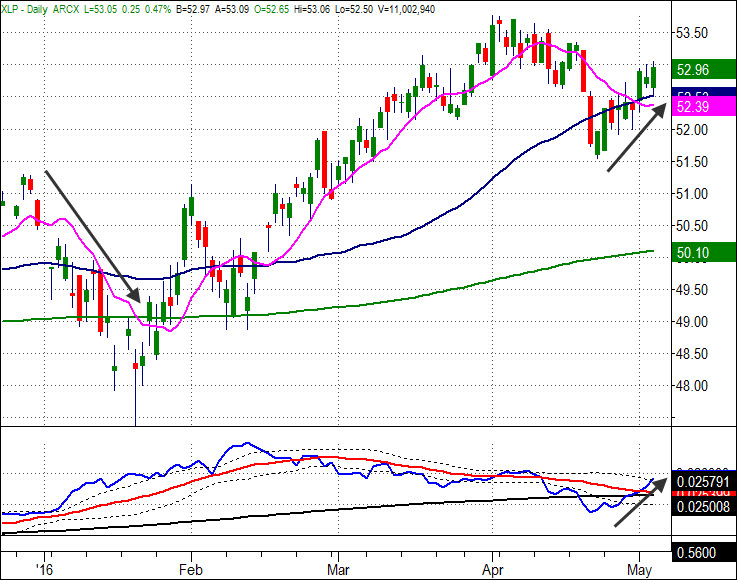
This chart also shows one of our Triple Play indicators below the daily candlestick chart, which represent the “price leadership” of the instrument. When the blue line is over the red the XLP is a leader in price. It will often lead the next direction of price so…
More importantly than it being a leader on the indicator, is that the price (candlestick chart) has been moving, and continued its move, up today with the market moving down.
If the market is going to get clocked. The price of XLP will break down too.
Look at January – XLP went down with the market. Just not as badly.
So if the market starts to slide keep your eye one XLP. If it’s strong the market may still be weak, but it should be manageable. Like today.
However if XLP is getting hit with the market, beware of more weakness in both.
S&P 500 (SPY) Broke 205 but held up. It’s still negative, but look for support at 204.
Russell 2000 (IWM) Continues to slide. Now well under the 200 DMA. Next big number is the 50 DMA at 109.40.
Dow (DIA) Held the big number of 176, but still it’s under pressure like the rest.
Nasdaq (QQQ) Has the look of a little double bottom, but not very convincing. First level to clear on the upside is 105.50. Until then the direction is still down.
XLF (Financials) Basically held 23 again which demonstrates why whole numbers are so important to watch in the markets. However, it’s now under the 200 DMA. Needs to get back over 23.30 to demonstrate any hope of strength.
KRE (Regional Banks) Bad breakdown continued today. Sitting on a big area of support from 38.75 to 38.25
SMH (Semiconductors) 54 pivotal and it closed below it today. It didn’t collapse, but there isn’t any good support until 50.25!
IYT (Transportation) Basically held yesterday’s low and stilll straddles the 50 and 200 DMA. Follow the direction of the break of today’s range, but resistance gets heavy starting at 142.40.
XRT (Retail) Sliding. Lots of resistance at 44.75. Support area is 43.50-43.00
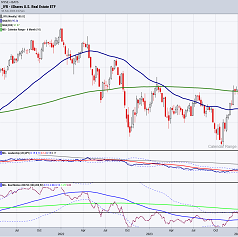
IYR (Real Estate) Following comments from yesterday played out nicely to the upside today ….”Nice inside day pattern, but probably a function of TLT’s move higher (lower rates). Nonetheless, one to watch on the upside over 77.80.”
GLD (Gold Trust) Consolidating. 121 is support and where it broke out of the channel from
SLV (Silver) May be a reversal. Like to see this hold 16.
GDX (Gold Miners) Continued to pull back hard from a dizzying run up. Closed under the 10 DMA for the first time is a month. Should find support here.
USO (US Oil Fund) Consolidating at support area. Needs to clear 11 to be back on the up swing. 10 should be good support
XOP (Oil and Gas Exploration) 5 down days in a row for the first time in a long time, but now sits on the 200 DMA and into other support. Wait for it to stop dropping.
TAN (Guggenheim Solar Energy) Continued its slide into bearish phase and through trend line from the Feb. lows, but into a support area. Wait for it to stop dropping. 22 is a big support level.
TLT (iShares 20+ Year Treasuries) Yesterday it had a big reversal gap up right into the 50 DMA and big resistance area around 130. Today it closed over yesterday’s high and is now back into an unconfirmed bull phase. However, Friday jobs report creates risk of a big gap.
UUP (Dollar Bull) Yesterday’s bullish key reversal on good volume followed through to the upside. Big resistance at 24.25 and no real support until 23.50 good support

Every day you'll be prepared to trade with: