August 31, 2016
Mish's Daily
By Geoff Bysshe

If you were focusing on the general market indexes (SPY, QQQ, DIA, IWM) this morning, it may have felt like a serious sell off was under way. The broad market was weak all morning.
But the morning bearishness gave way to a rally back to almost break even by the end of the day.
As a result, today was a very good example of how to use leading sectors to identify the days when intra-day dips should be viewed as a buying opportunity rather than time to sell.
In my last two posts I’ve highlighted two different “big picture chart points” to help you read the market more confidently, and today I have another one for you.
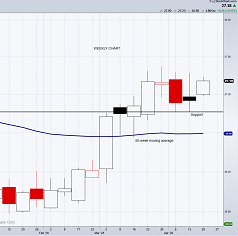
All four of the major indexes are in a bullish phase, and they have very clearly defined ranges of good support. In fact, one of those ranges (the Fed Day on Friday) was the topic of yesterday’s post.
When the market is in a healthy trend it’s important to know which sectors are the leaders, because they can help you determine which weak days to buy on the dip and which ones to avoid.
The morning weakness was blamed on the energy sector and weakness in global markets, and that may have been the correct assessment, but that is also the type of down market that sets up great opportunities!
The energy sector is not a major leading sector right now and global markets are not driving our markets right now either, although sometimes they do.
It’s good to know the reason for a declining market, but the most important question to answer is – are the leading bullish sectors leading the down day lower? If the answer is yes, then the decline may be serious. If the answer is no then the decline may be an opportunity to buy, or at least a reason not to sell.
Right now the two “stand out” bulls in the Economic Modern Family sectors are the semiconductors (SMH) and the financials (KRE).
Despite being leaders, these sectors were both down in the morning with the market, so how do you know that they are not leading the market lower?
When you’re looking at how sectors are trading relative to the market, consider relative price points. The example of this today was to look at their respective prior day lows.
The SPY, DIA and IWM where all trading well below their prior day lows, but the KRE never broke its prior day low, and the SMH was quick to recover after it tested its prior day low.
When the leading sectors start to turn up at key relative levels that the general market has broken, it’s often an indication that the general market decline has limited downside left.
In this situation you can look to that market leading sectors and ETFs for buying opportunities.
Furthermore, if you’re watching the leading sectors closely, you’ll know when they don’t hold their key relative levels of support! In this case you’ll know to be more bearish.
I began by stating that the general market is in a bullish trend. This is important, because this tactic works best when you’re trading in the direction of the bigger trend.

Every day you'll be prepared to trade with: